![[Carmen logo]](images/carmen-logo-small.png) |

|
The Carmen Navigator GUIThe CARMEN Navigator GUI is a graphic user interface which allows a user to
Starting navigatorgui is described on the Running Carmen page. This page is presented to further explain the functions of the program. Once started properly, the user interface appears as below.
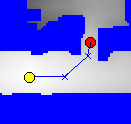
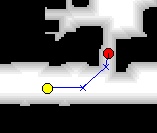
 In the status box, the robot position is indicated in meters from the lower left corner of the map, (horizontal, vertical) and then degrees from 3 O'Clock facing, counterclockwise being positive. (The standard, right-handed co-ordinate system.) The current robot goal is also indicated this way, but without facing component. The computer cursor position (for the computer you are displaying on) is measured in grid cells from the lower left of the map. Value indicates the likelihood that the grid cell under the cursor is occupied, according to the map file. A value of 1.00 indicates that cell is sure to be occupied. Negative values indicate unmapped regions (no data). Clicking the "Autonomous" bar will cause the robot to move toward its goal, or stop it if it is already moving. Clicking on the map display will set a new goal, overiding any old goal, only of "Autonomous" is inactive (the robot is not moving). It is possible to gove the robot a goal it cannot reach. Should you do that, no indicated path will appear between the robot and the goal, as below.
 The "Zoom" slider at the bottom of the display allows users to zoom in or out on the map for more detail or more area. The slider bars to the right of and below the map allow users to shift the section of the map being displayed. The menus "Start Location" and "Goals" allow you to select starting locations for the robot or robot goals that are built into map files. Adding or deleting locations is described in the Using the Map Editor page. Another way to place the robot is to right-click on a position in the display. This will change the robot's perceived location; any paths planned by Navigator will be based on this position, not the actual position of the real or simulated robot. Another way to set a goal is to left-click a place on the map. The "File" menu option allows you to save a display image to a .png file. this will only save what is between the slide bars, it will not save the whole map (unless the display is fully zoomed out), nore will it save the status box. The file will appear in the directory from which navigatorgui is running, with a filename [mapfile].map#.png, where [mapfile] is the name of the mapfile in use, and # is the number of times previously a screen has been saved. The "Show" and "Robot Display" menus are described below. Note that under the "Show" menu, the options of "Map", "Utility" and "Cost" are mutually exclusive; the display can only show one of these options at a time.
| |||||||||||||||||||||||||||||||||||
| Copyright © by the CARMEN-Team |

